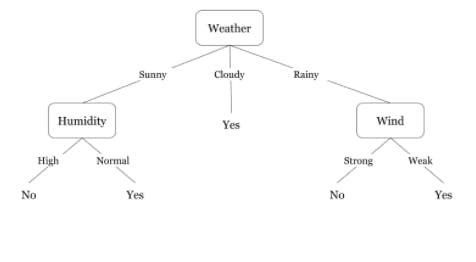
Decision Tree
A decision tree is a diagram that depicts the various outcomes of a set of connected decisions. Because of its similarity to the namesake plant, the chart is termed a decision tree, and it's generally shown as an upright or horizontal layout with branches. Each "branch" of the decision tree represents a possible decision, consequence, or reaction, starting with the decision itself (called a "node"). The "leaves" are the tree's furthest branches, which reflect the end results of a particular choice process. Decision trees are used to clarify, map out, and discover a solution to a complicated situation.

How does it Work?
A decision tree is a graphical representation of a decision and all possible outcomes or consequences of that decision. Individuals use decision trees in a wide range of scenarios, from basic personal matters to more sophisticated industrial, scientific, or microeconomic endeavors. Decision trees provide individuals with an effective and simple approach to see and comprehend the potential impacts of a decision and its range of possible outcomes by showing a series of stages. The decision tree also assists people in identifying all possible options and balancing the risks and benefits of each course of action. Decision trees can be used as a decision support system in an organization. Users may use the structure to showcase many alternative solutions to a problem in a clear, easy-to-understand style that also highlights the link between distinct events or decisions. Each end outcome in the decision tree has a risk and reward weight or number assigned to it. When a person utilizes a decision tree to make a choice, they may analyze the pros and downsides of each ultimate conclusion.
How to Make a Decision Tree
Begin with a specific choice that has to be made to create a decision tree. To illustrate the initial choice, draw a small square to the far left of the ultimate tree. Then, draw lines outward from the box, each line indicating a potential choice that travels from left to right. However, you may start from the top of a page or screen with a square and draw lines in the downward direction. Analyze the findings at the conclusion of each line of choice. Draw a box at the end of a line if the outcome of a choice is a new decision, and then draw additional lines out of that decision, indicating the new possibilities and naming them appropriately. Draw a circle at the end of the line to indicate possible risk if the outcome of an option is unknown. Leave a line blank if an option leads to a choice. You keep expanding until every line hits an endpoint, indicating that you've covered every option or result. To mark the endpoint, draw a triangle.